|
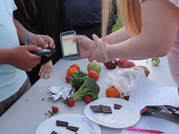
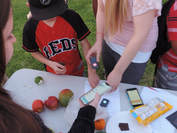
Today the innovation lab visited and showed us the SCIO, "pocket spectrometer" that scans things around us and shows their chemical make up. See the video below about how it works.
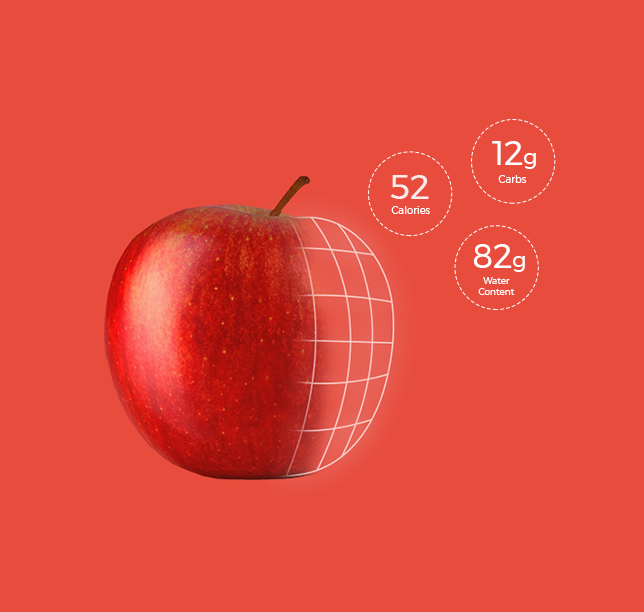
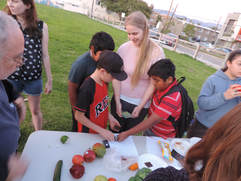
We talked about our favorite types of apple, and then used an app with the Brix scale that farmers use to see which apple was the sweetest and the most nutritious. Fuji won! We also looked at other fruits and veggies. Most people's favorite part was comparing the nutrition and cocoa content in different types of chocolate. Turns out white chocolate has no cocoa. Didn't stop people from sampling it though! 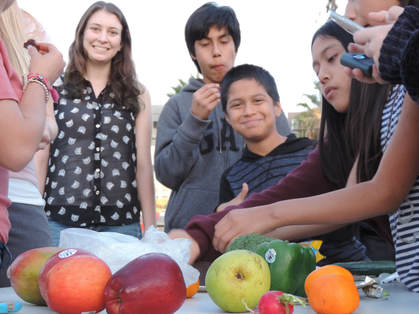
0 Comments
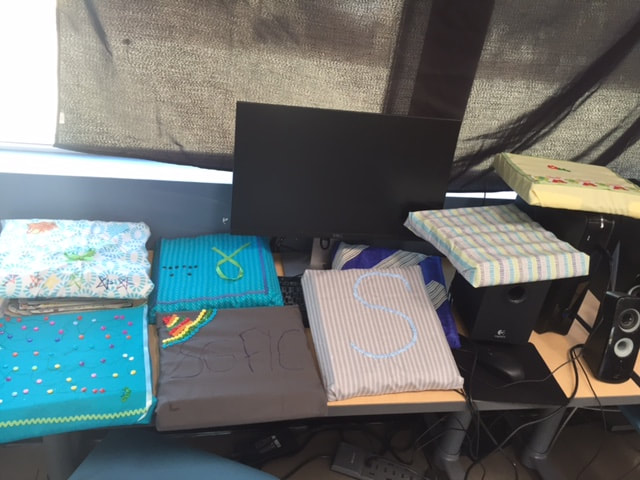
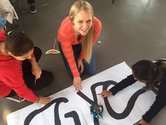
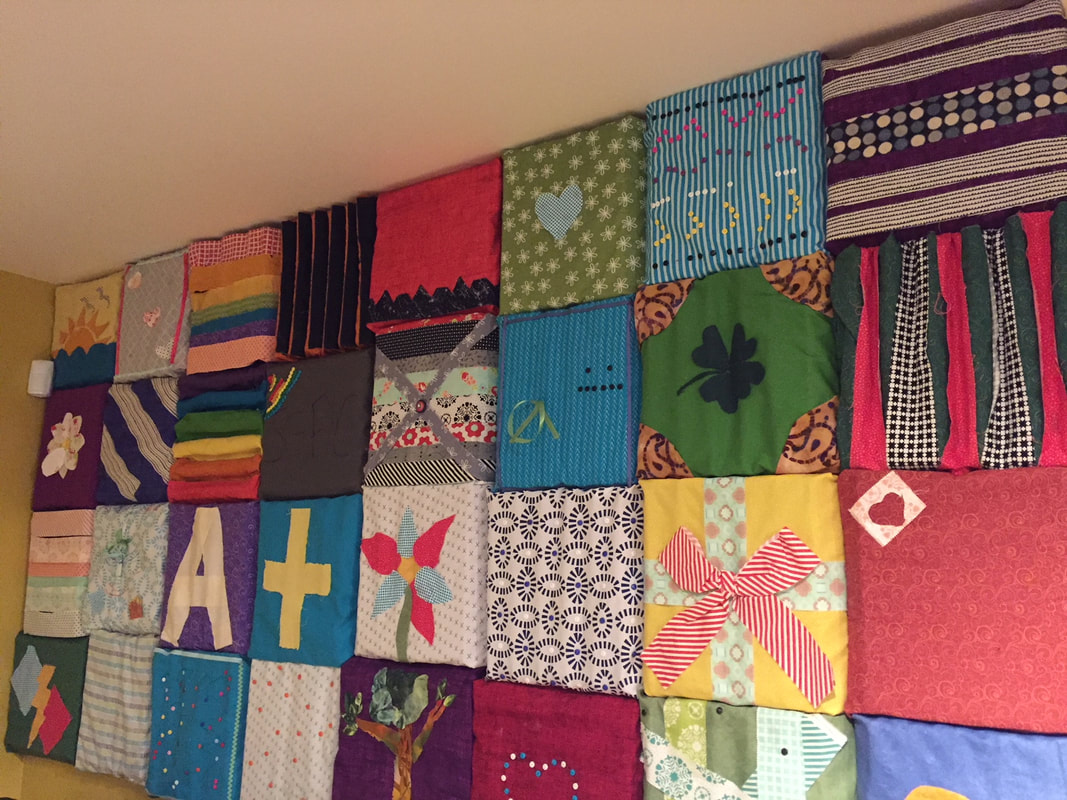 We drilled holes in the four corners of each of the five plywood sheets and installed the panels on the wall in the homework room today. Looking good! Can you find the "SB" for Santa Barbara? Or the "A+" for everyone hard at work in the homework room? Starting with the sun panel and ending with the moon was also an important design choice. 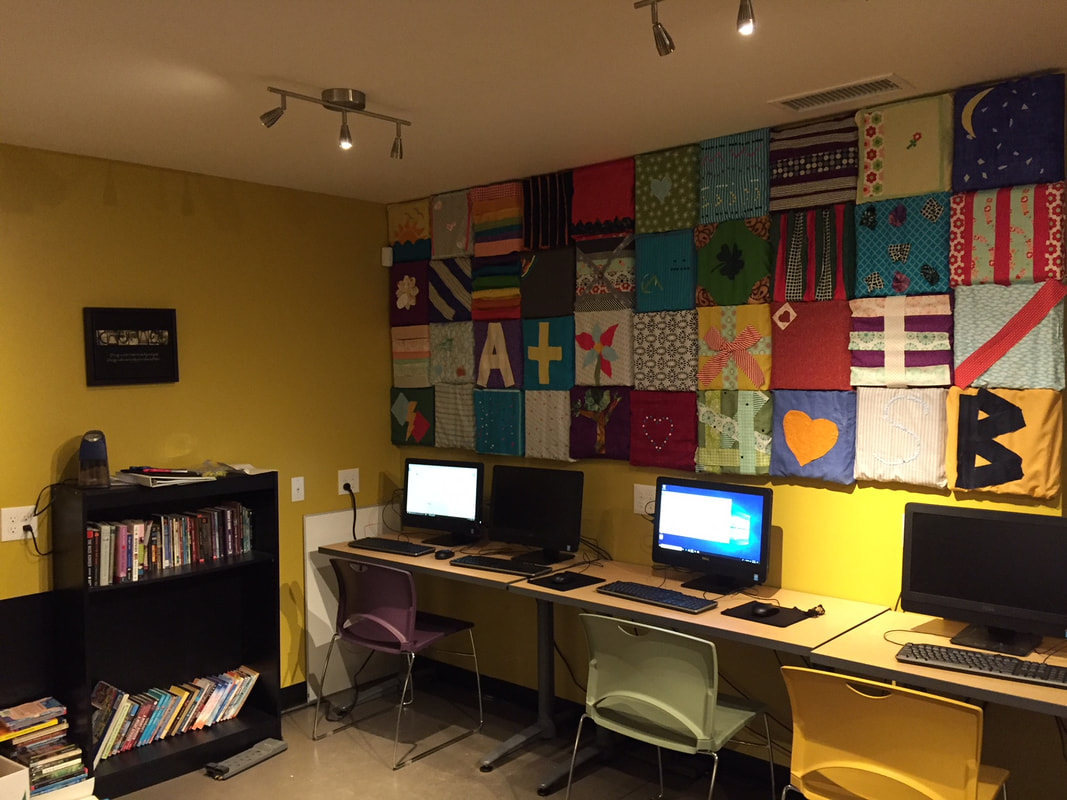
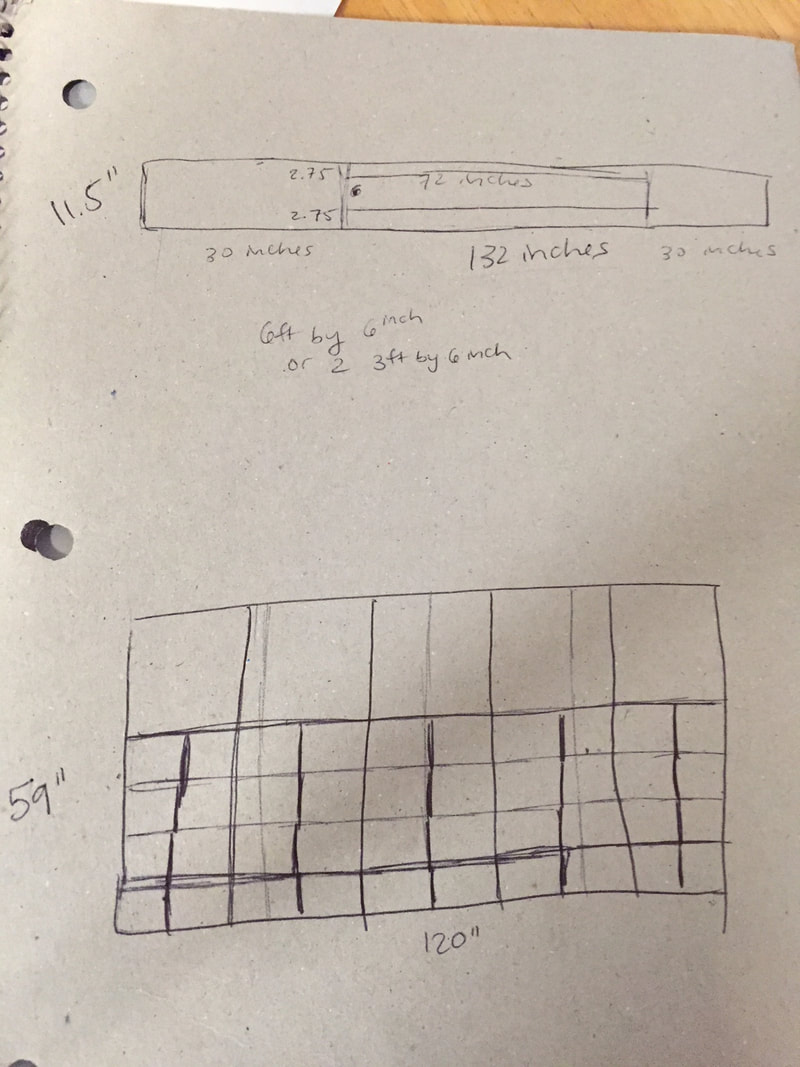
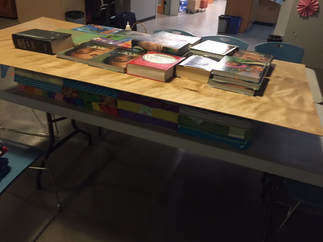
We did more pre tests to see not only the overall noise levels, but the amount of echo or reverberation. We used a balloon popping sound on a computer to keep the sound the same in every test. Below is the video on how to set up this test. We also are trying another way of putting up the sound panels, so they are glued to plywood instead of glued onto the wall with adhesive spray. We arranged the panels on five sheets of plywood, careful with the overall design, then used textbooks to help the glue set. Hopefully this time the panels stay on the wall more than a month!
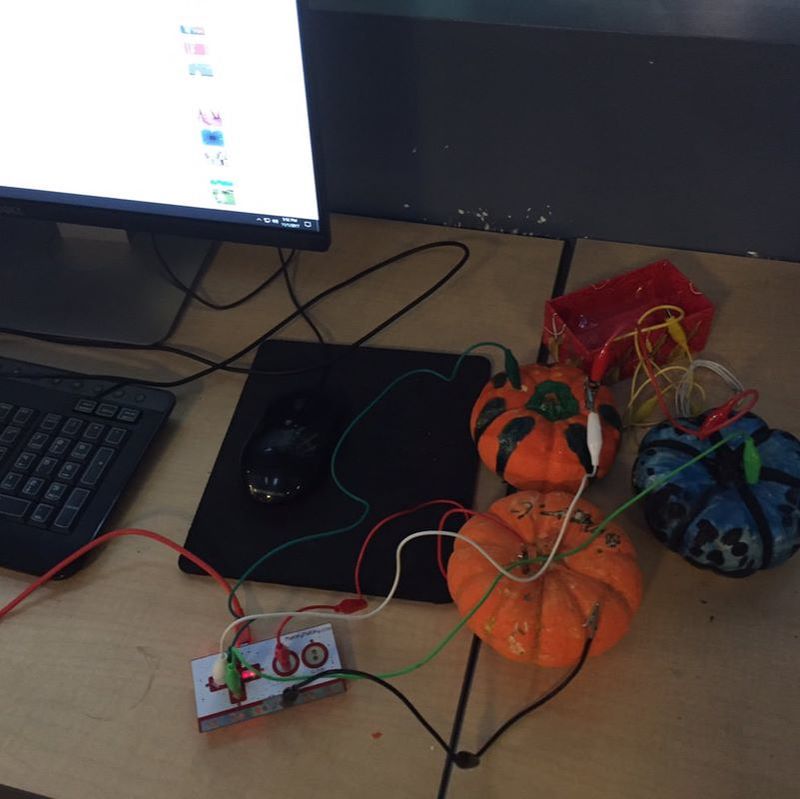
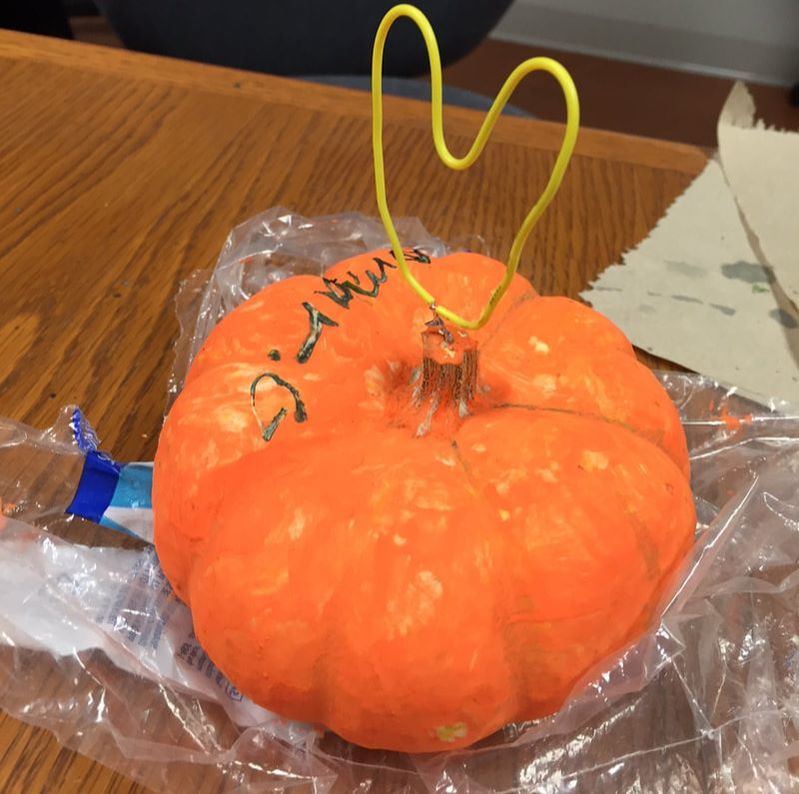
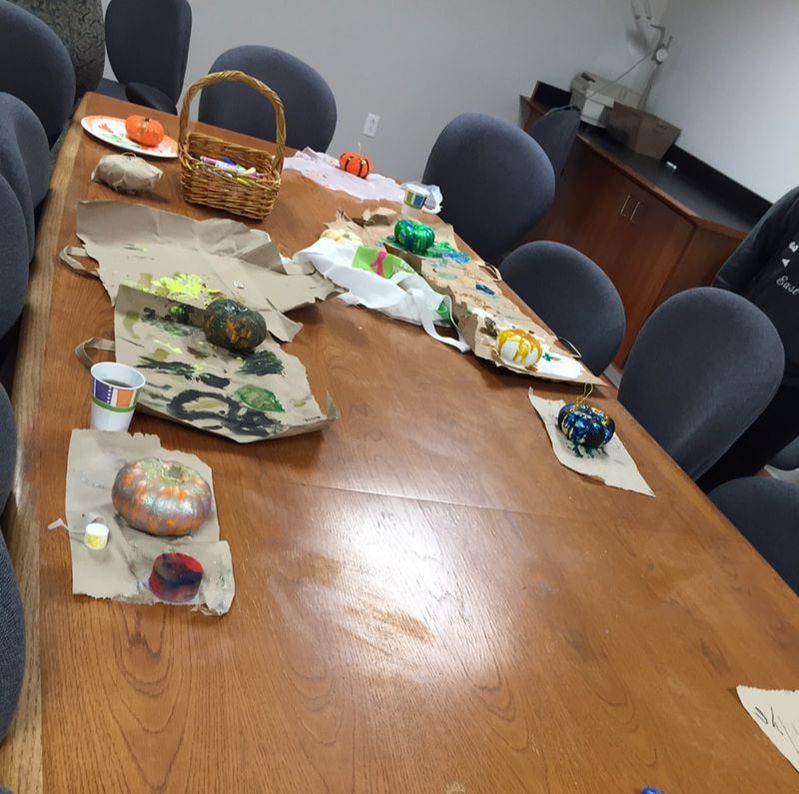
We've been busy! First incorporating virtual reality into this year's Haunted House. We found a video of The Forest with a girl camping and re-created the tent scene, using a parachute hanging from the ceiling and sleeping bags. With 4 Google Cardboard viewers, everyone in each tour group got the immersive experience. Check out the video in 360! We also painted pumpkins and used the Makey Makey to set up a pumpkin piano.
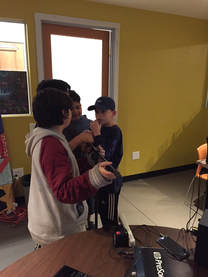
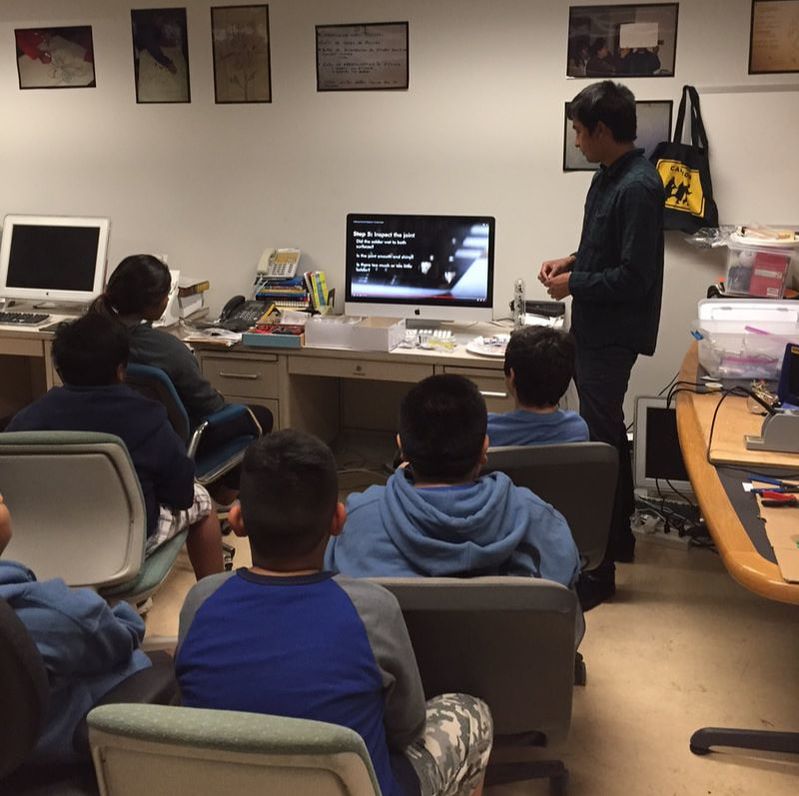
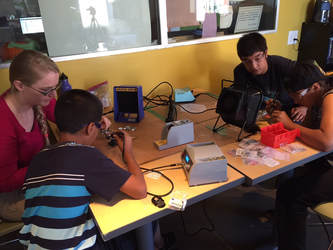
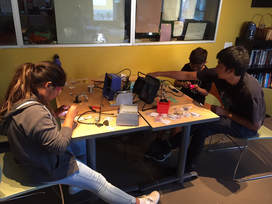
And, we visited the Ubicomp/Innovation Lab at GGSE/UCSB for a soldering lesson.
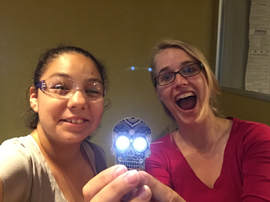
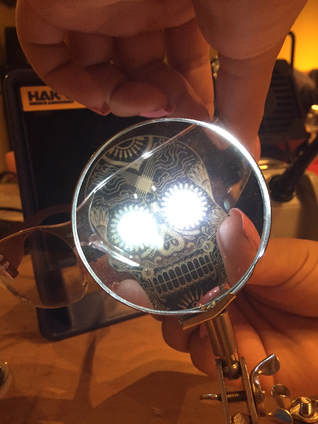
We used a soldering iron to melt a filler metal to permanently connect two other metal pieces on the skull badge. Everyone was able to create a wire bracelet to practice, and then did a Day of the Dead skull badge from Adafruit by soldering the battery holder, the LED lights, and the pin part back at the Center. Some people even learned to desolder if things weren't attached quite right the first time.
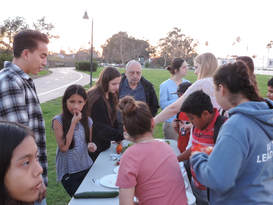
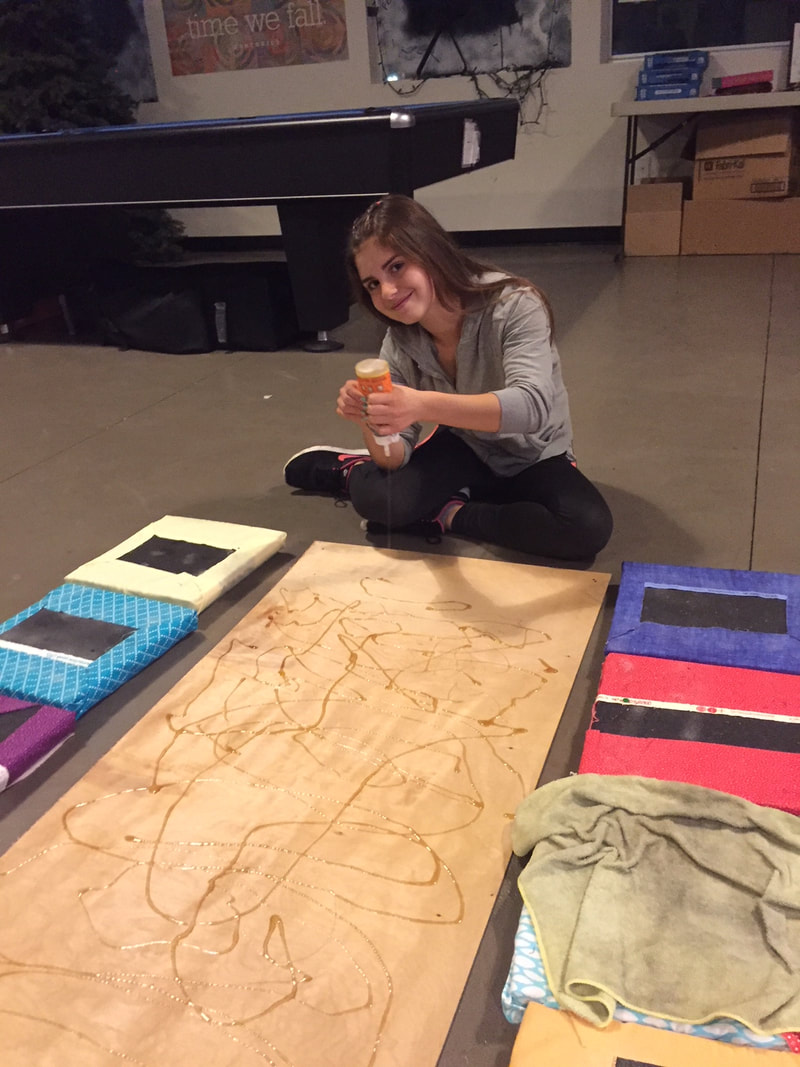
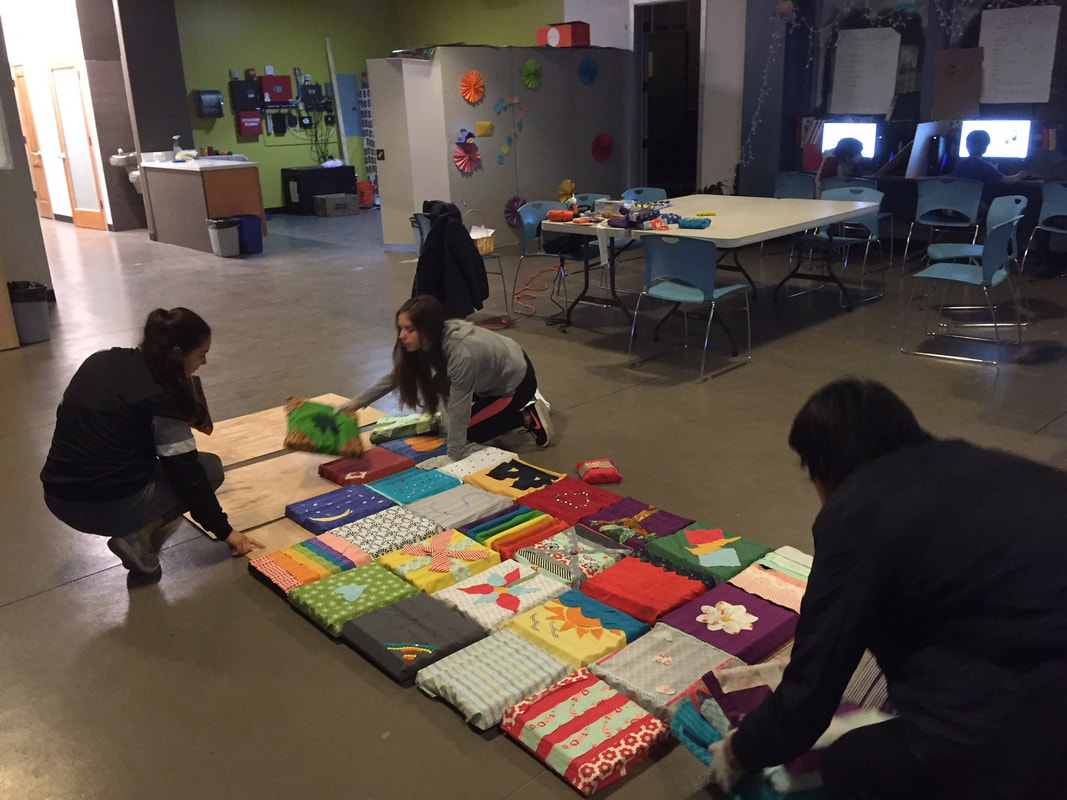
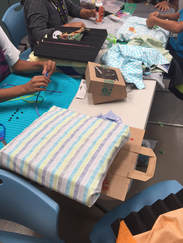
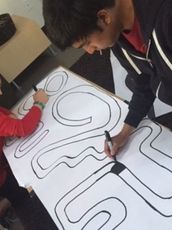
For the final part of the sound project, we invited people from the Teen Center and the community to decorate foam acoustic panels with fabric to reduce noise in the homework room in a personalized, beautiful way!
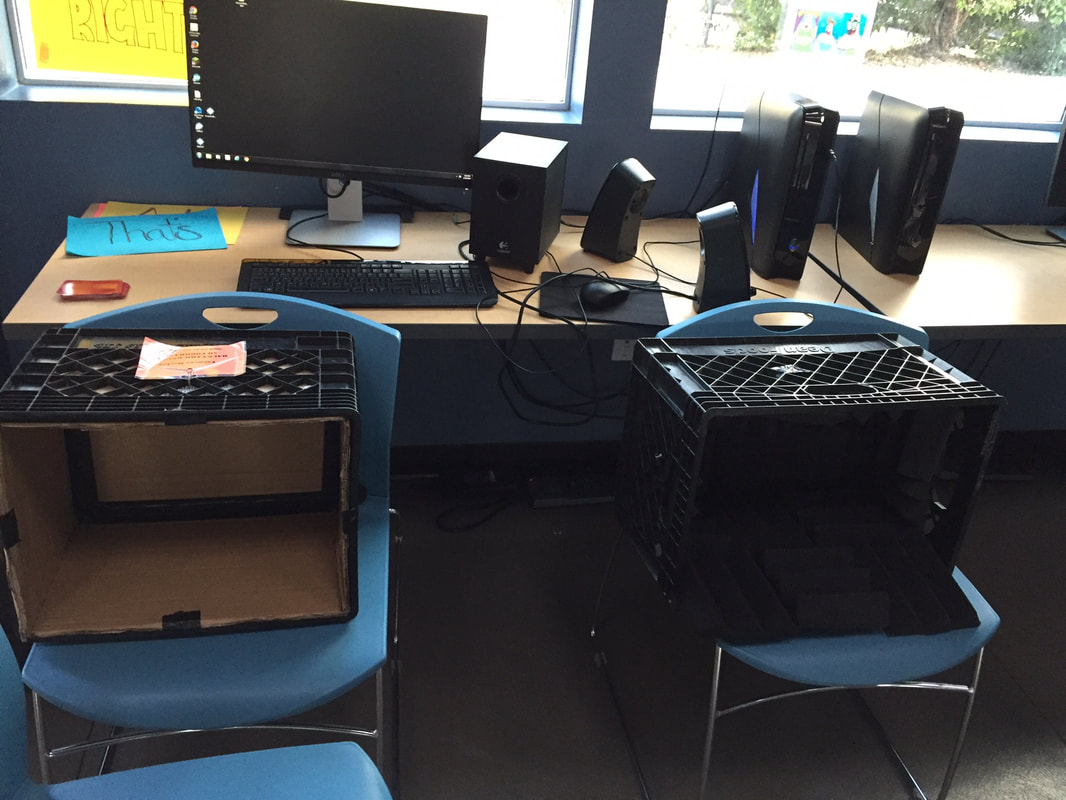
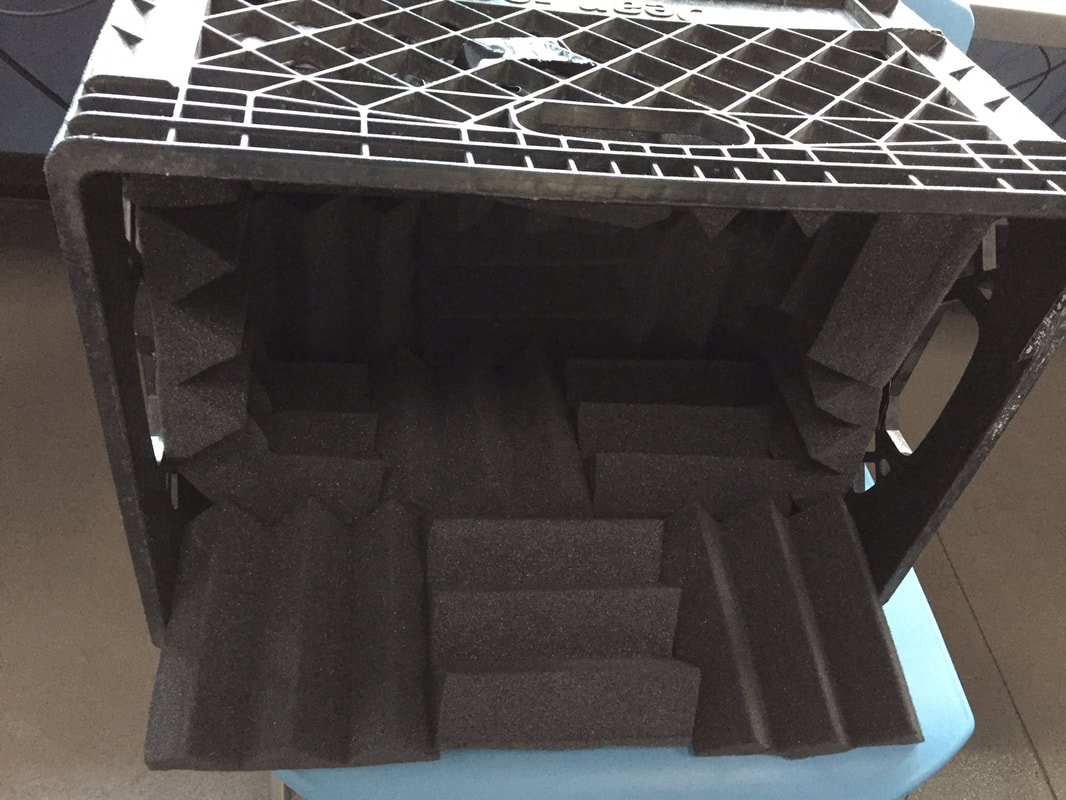
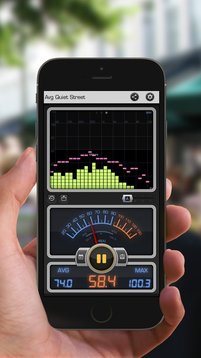
First we did some testing to get "before" conditions for the homework room. We created the "mini rooms" to model with and without sound panels and compared using speakers, various sound meters on phones, and even our heads. Next we used a sound meter to test sound levels in the homework room in a variety of conditions including silence, small talk, music playing, someone singing or yelling, and a frequency sweep. We also considered whether the sound was coming from inside or outside of the homework room.
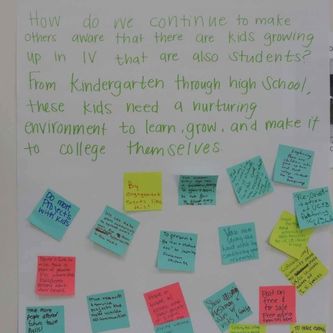
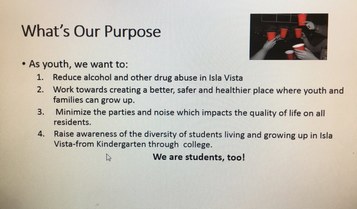
Creating the acoustic panels...so far we've made over 30! 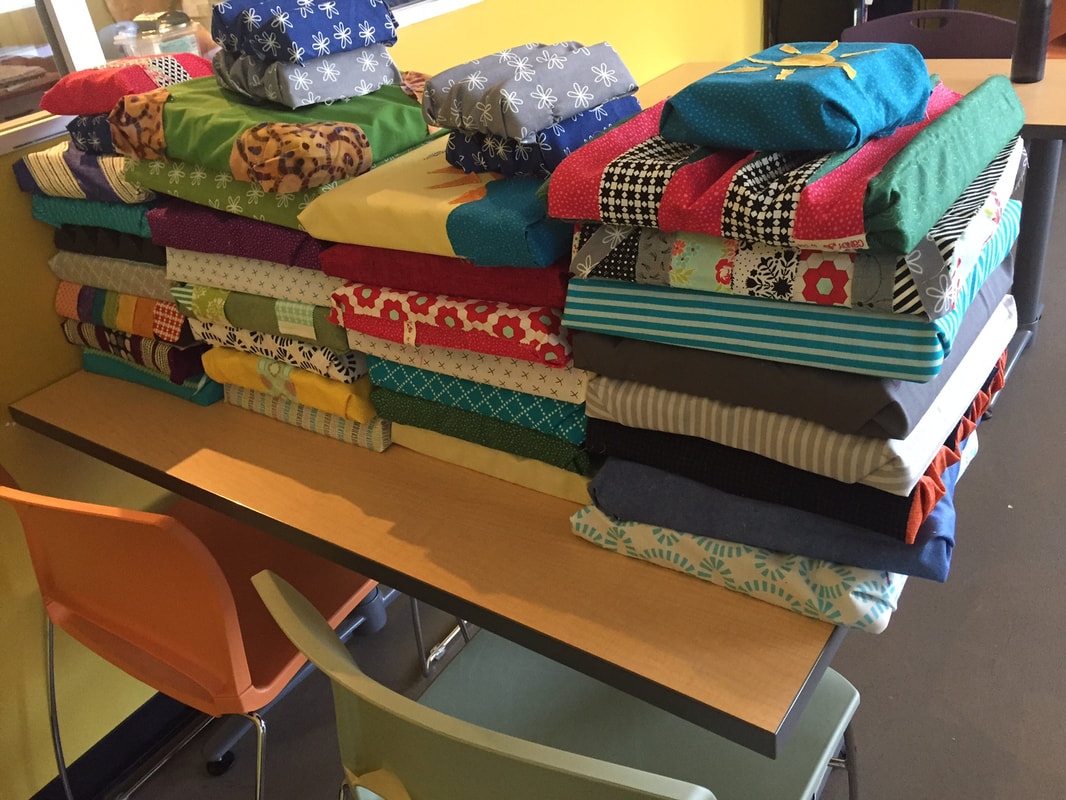 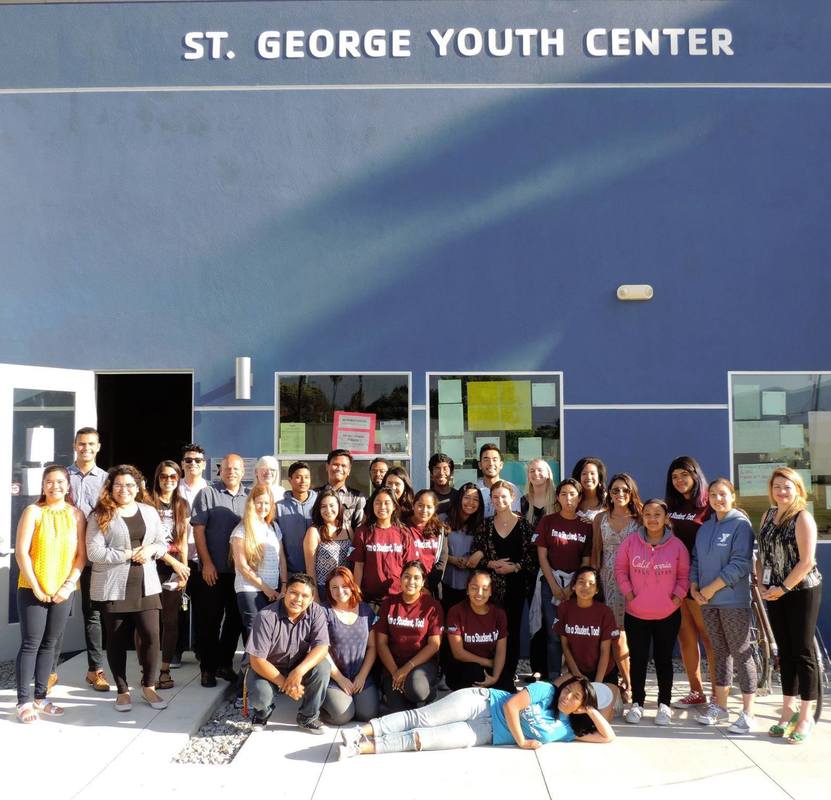 Everyone did a great job presenting today! Our data analysis team presented on the sound project and their participation as community scientists, but it's important to recognize this is only one part of the larger "I'm a Student Too" campaign that these youths have been working on for the past two years. The extent of their data collection and analysis is impressive, as is their commitment to making Isla Vista a "better, safer and healthier place where youth and families can grow up."
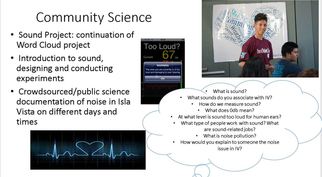
Our data analysis team began by presenting how sound was a big issue in the initial survey, and their response of collecting data on sound levels to answer specific questions seen below. 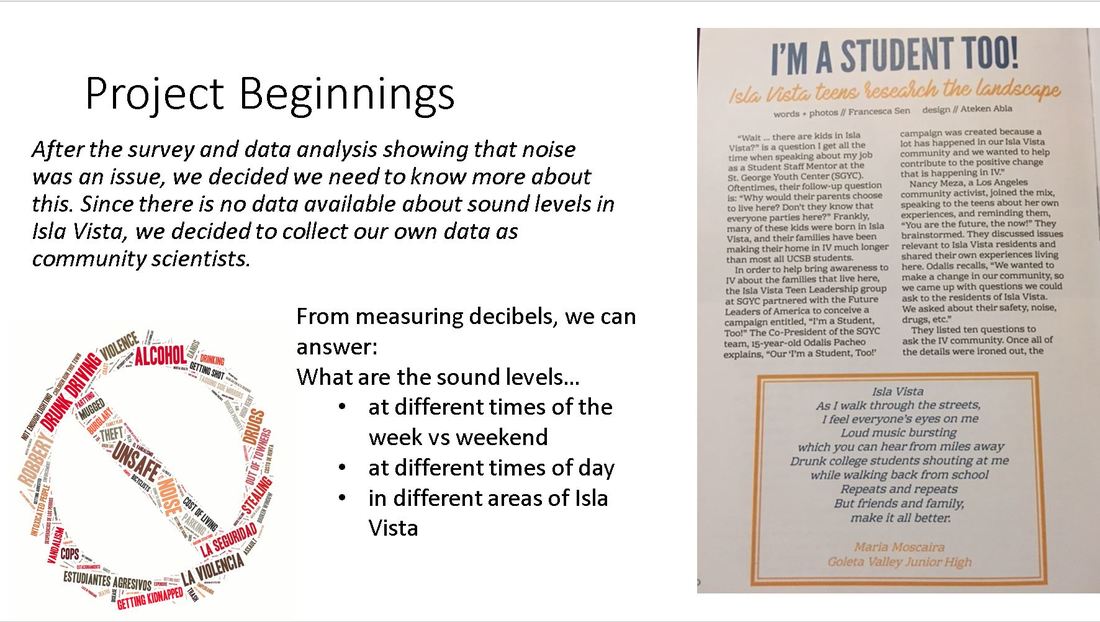 They also presented on the process of data collection and analysis for the sound project that took place over the past few months. 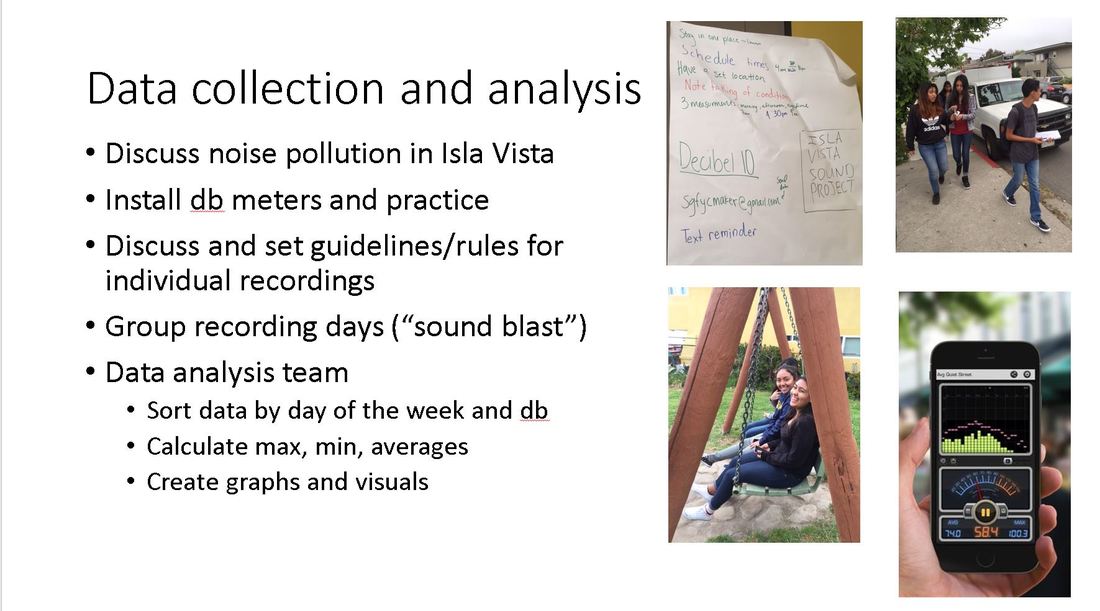 Finally, they showed some of their results. See previous blog post for graphs, and check out the map below of representative sounds! We've been busy this week! Our data analysis team created graphs and visuals to represent the data.
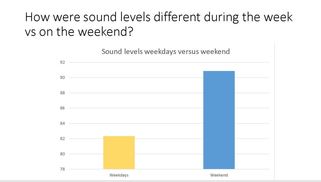
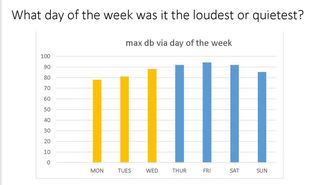
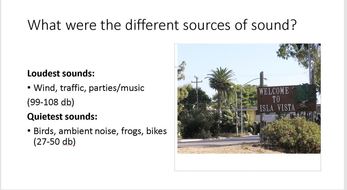
One group worked on creating sound graphs and figuring out which types of sounds created the loudest and quietest decibel readings. We created graphs using the max and average db readings according to time of day to see which days and which time periods were the loudest.
Another group created a map of Isla Vista and polled people about which sounds to include on the map. Then they helped create an interactive map with representative sounds at places such as Children's Park, the Habit, the Loop, the Teen Center. A photo of our map in progress is below, the video will be next! 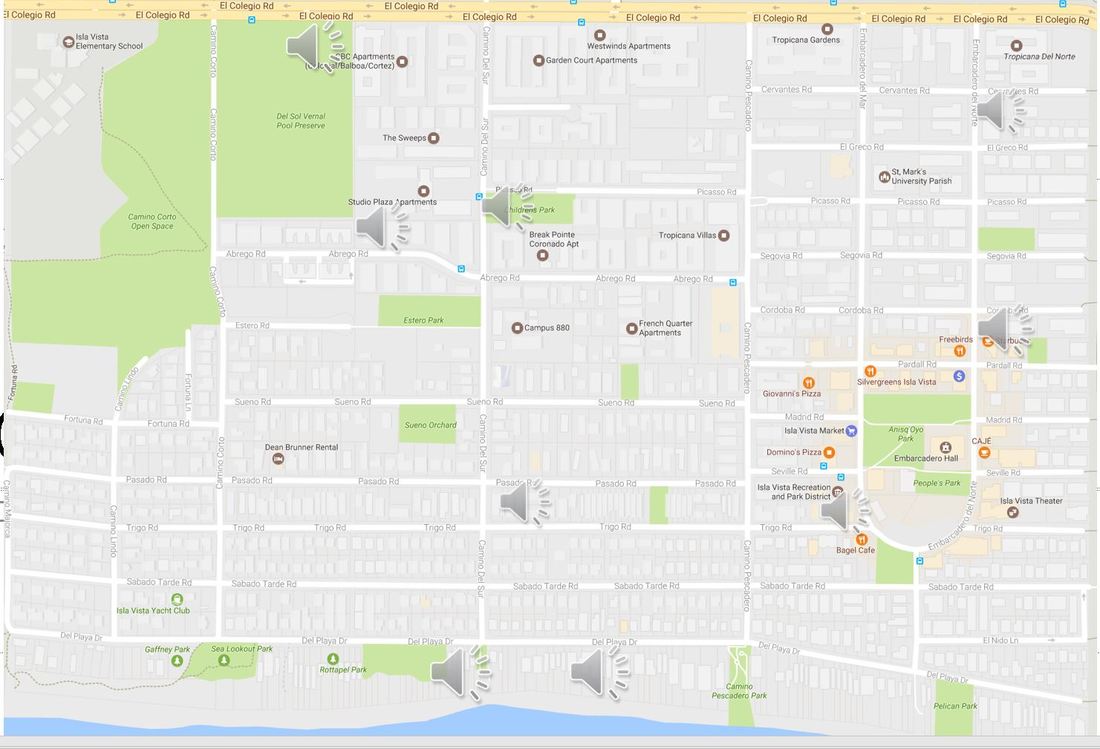 We downloaded and formatted data today, looking over the dates from March to May, the location, time of day, max, min and average sounds. We have over 125 data points from our sound blasts and people collecting it on their own! A big thanks to Saul for help with organizing the data into a readable excel format. 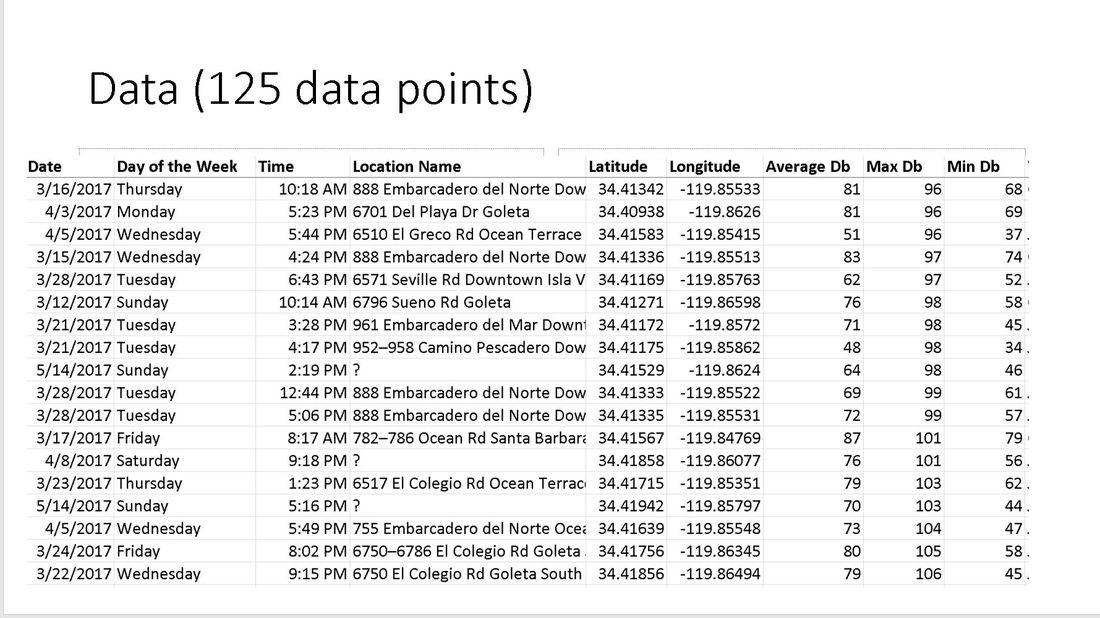 Our data analysis team also thought about their original questions and came up with these to look through for the next step:
•What day of the week was it the loudest? •What day of the week was it the quietest? •What time of day was it the loudest? •Where was it loudest? •What caused these different types of sounds? •What source caused the loudest sound?
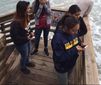 Today we split into groups to reach different parts of Isla Vista and collect sound data on smart phones using DB 10.
|
AuthorSt. George Youth Center Teens Archives
October 2019
Categories
All
|
 RSS Feed
