|
We've been busy this week! Our data analysis team created graphs and visuals to represent the data.
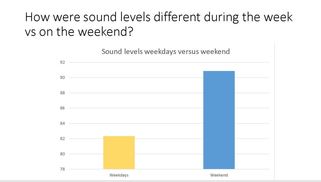
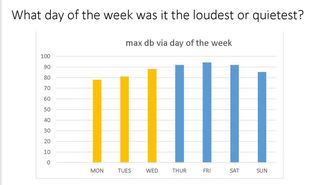
One group worked on creating sound graphs and figuring out which types of sounds created the loudest and quietest decibel readings. We created graphs using the max and average db readings according to time of day to see which days and which time periods were the loudest.
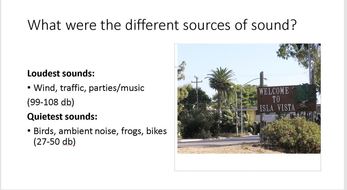
Another group created a map of Isla Vista and polled people about which sounds to include on the map. Then they helped create an interactive map with representative sounds at places such as Children's Park, the Habit, the Loop, the Teen Center. A photo of our map in progress is below, the video will be next! 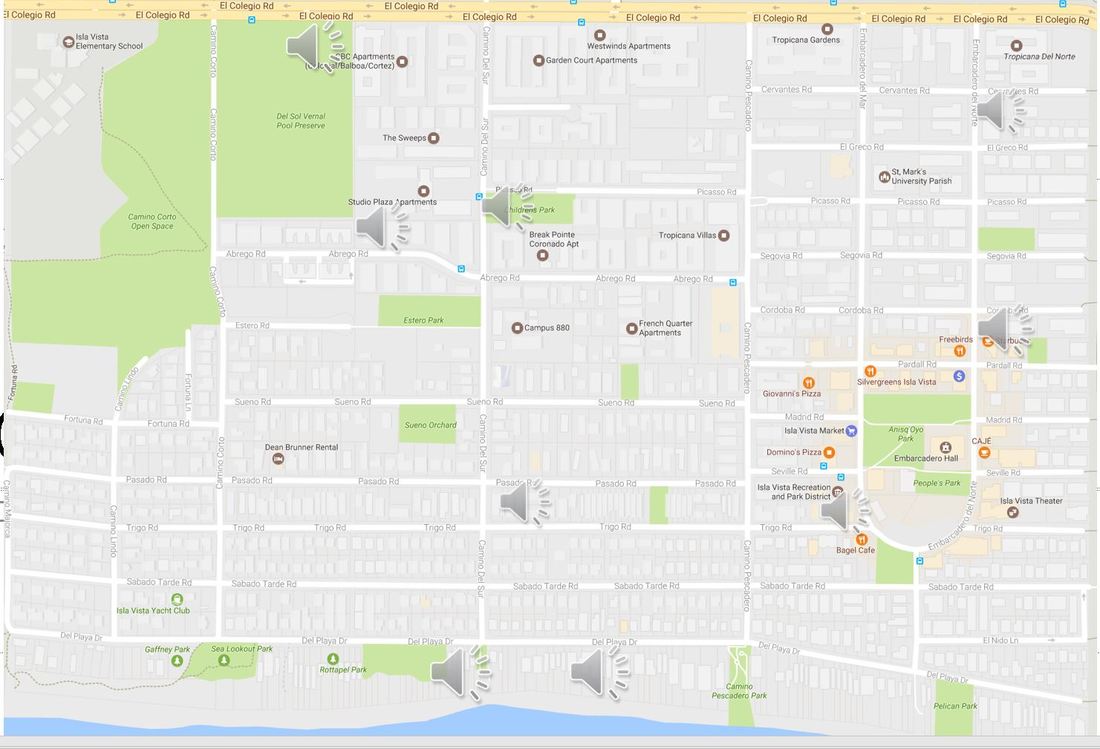
0 Comments
We downloaded and formatted data today, looking over the dates from March to May, the location, time of day, max, min and average sounds. We have over 125 data points from our sound blasts and people collecting it on their own! A big thanks to Saul for help with organizing the data into a readable excel format. 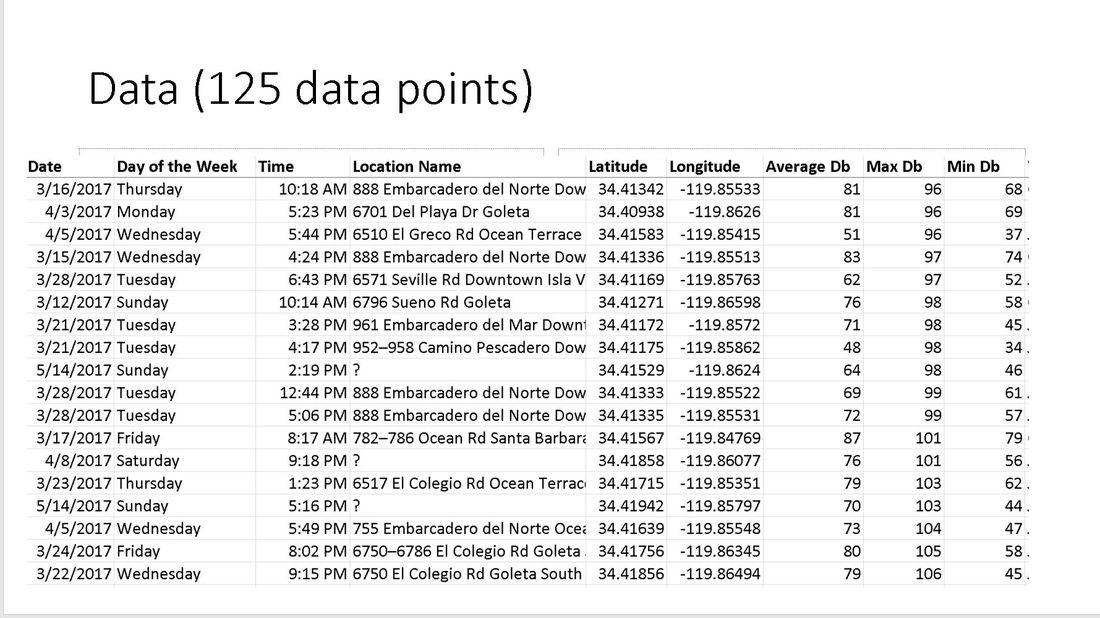 Our data analysis team also thought about their original questions and came up with these to look through for the next step:
•What day of the week was it the loudest? •What day of the week was it the quietest? •What time of day was it the loudest? •Where was it loudest? •What caused these different types of sounds? •What source caused the loudest sound? |
AuthorSt. George Youth Center Teens Archives
October 2019
Categories
All
|
 RSS Feed
